Sheet 03 · Site survey · 7°38′S 112°54′E

Public budget transparency dashboard 2026

APBDes Sungai Pinang Nibung

A public village budget monitoring dashboard that turns the APBDes billboard into charts, realization tracking, downloadable reports and resident complaints.

Laravel 13 PHP 8.4 MySQL Blade Vite Chart.js PhpSpreadsheet laravel-dompdf
Role Full-stack Developer
Year 2026
Stack Laravel 13, PHP 8.4, MySQL, Blade
Team Solo build
Overview

What this project needed to solve

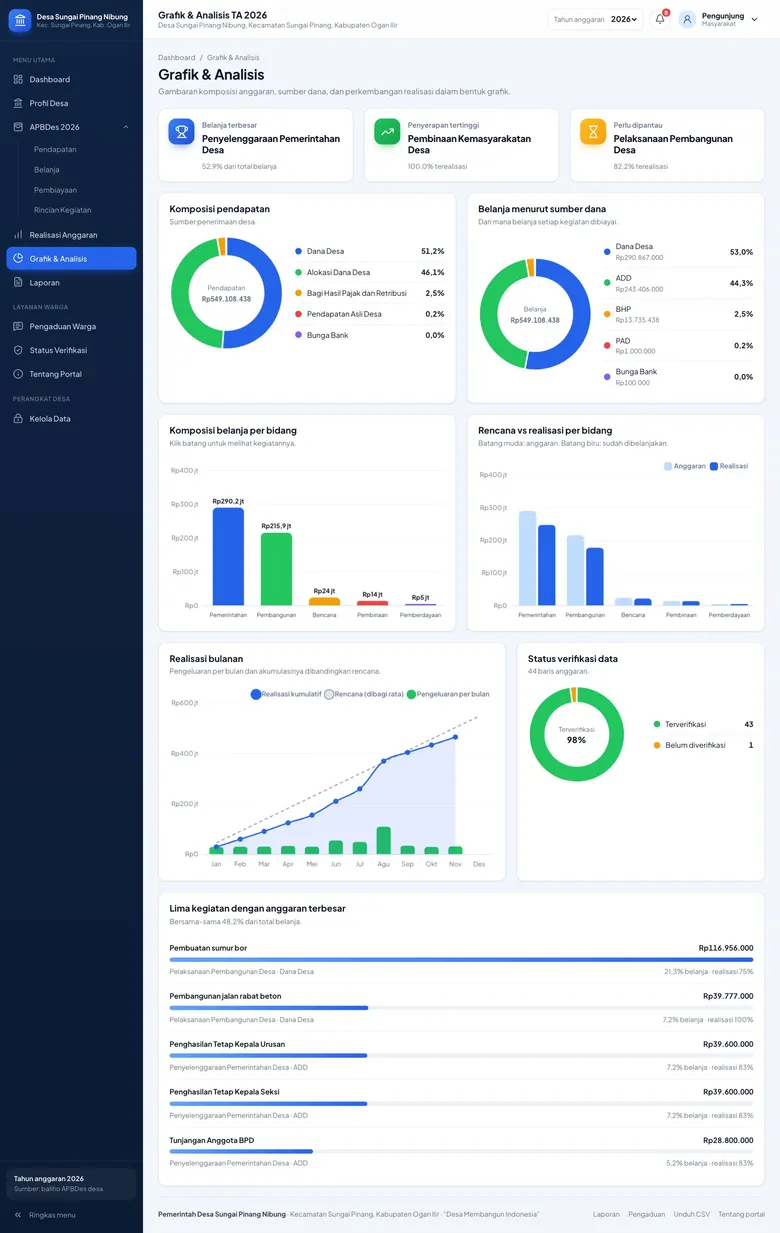
A web dashboard for monitoring the village budget (APBDes) of Desa Sungai Pinang Nibung, Kecamatan Sungai Pinang, Kabupaten Ogan Ilir. Residents can browse income, spending, financing and activity details without logging in, follow monthly realization against the plan, download monthly or semester reports, and send complaints or questions. Village officials log in to manage budget data, record spending and answer residents. The planned budget figures are copied from the village's public APBDes 2026 billboard, and the interface follows the mockup in a capstone proposal.
Problem framing

From messy workflow to clearer product requirements.

The work started by separating staff operations from customer booking needs, then turning both into clearer product requirements.

Challenge

What made the work difficult?

The village budget was published on a physical billboard, which shows totals but not how spending progresses through the year. Residents had no simple way to see which activities had been funded, how much had been spent, or to ask questions about specific items. The data also had to stay faithful to the official figures, including typos and duplicate line names on the billboard that needed careful handling.

User and business need

What had to become clearer?

Village officials needed one place to keep APBDes data, record realization per activity and produce reports, while residents needed open, read-only access to the same figures. Without such a tool, budget transparency depended on a static billboard and manual reporting.

Process

How the project moved from requirements to usable flow.

01

The layout follows the mockup from the capstone proposal, with a sidebar split into public pages, citizen services and village staff tools. Budget lines were transcribed from the APBDes 2...

Solution

What I built and why it mattered

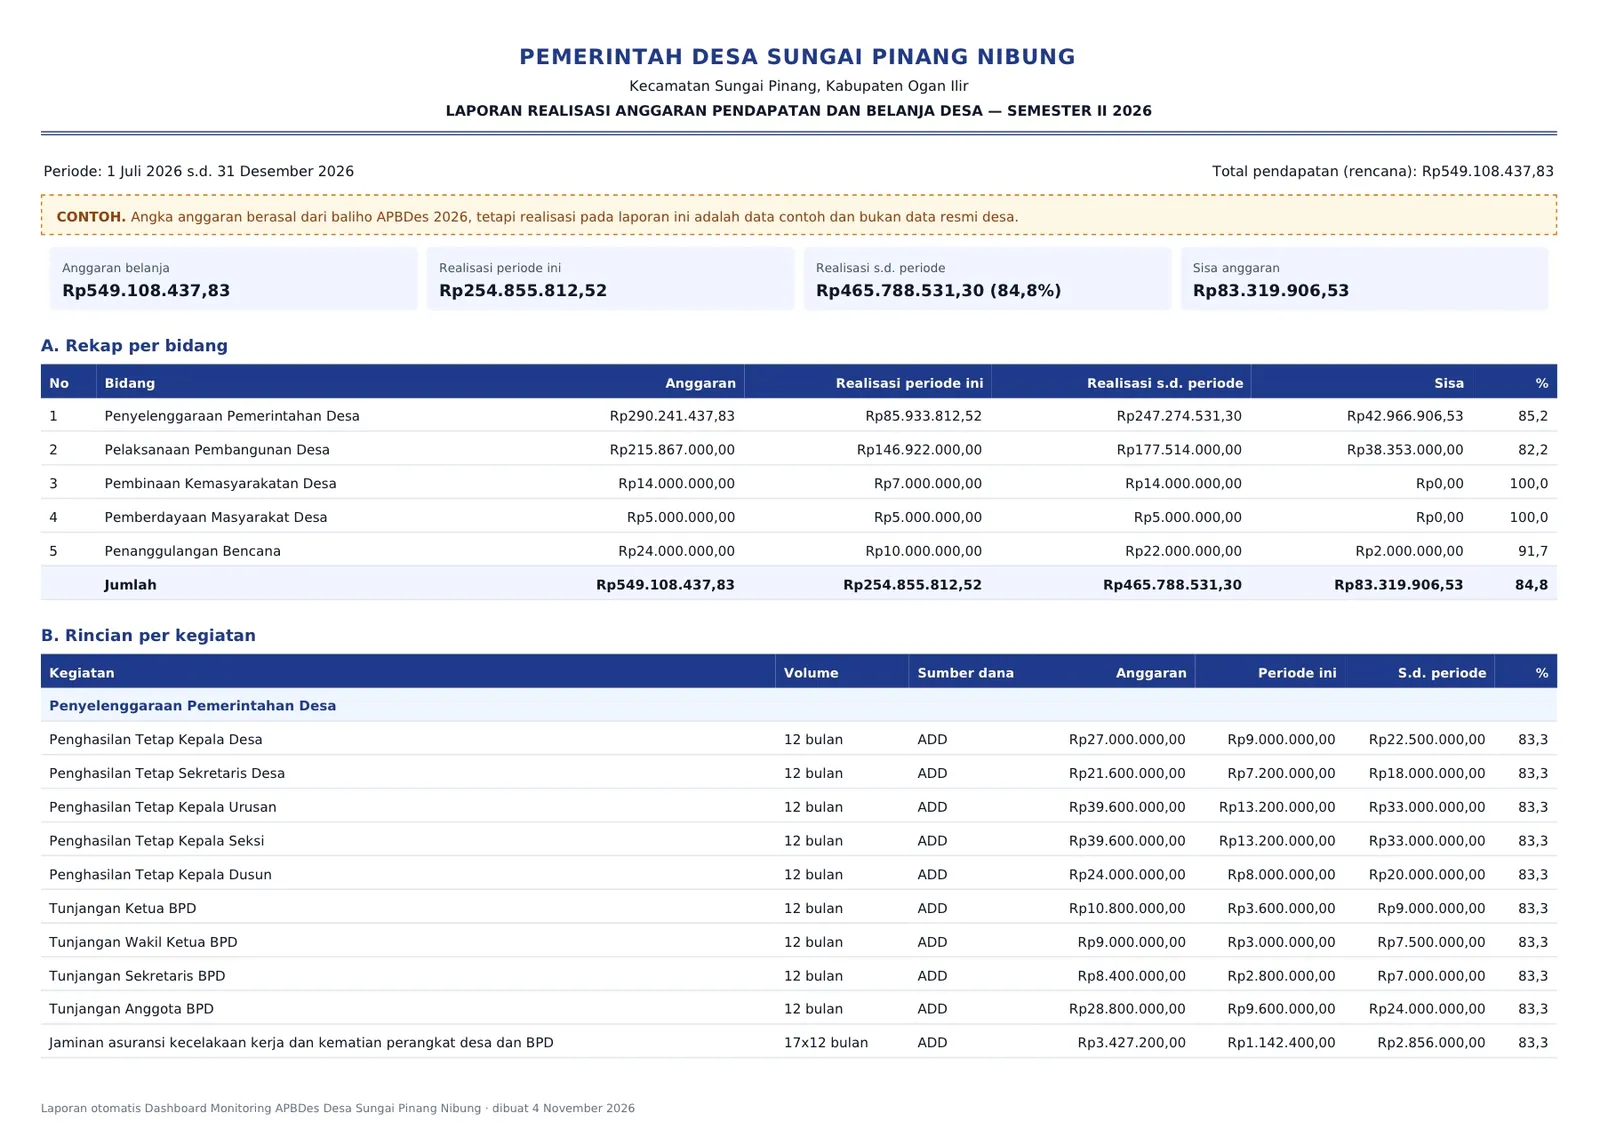
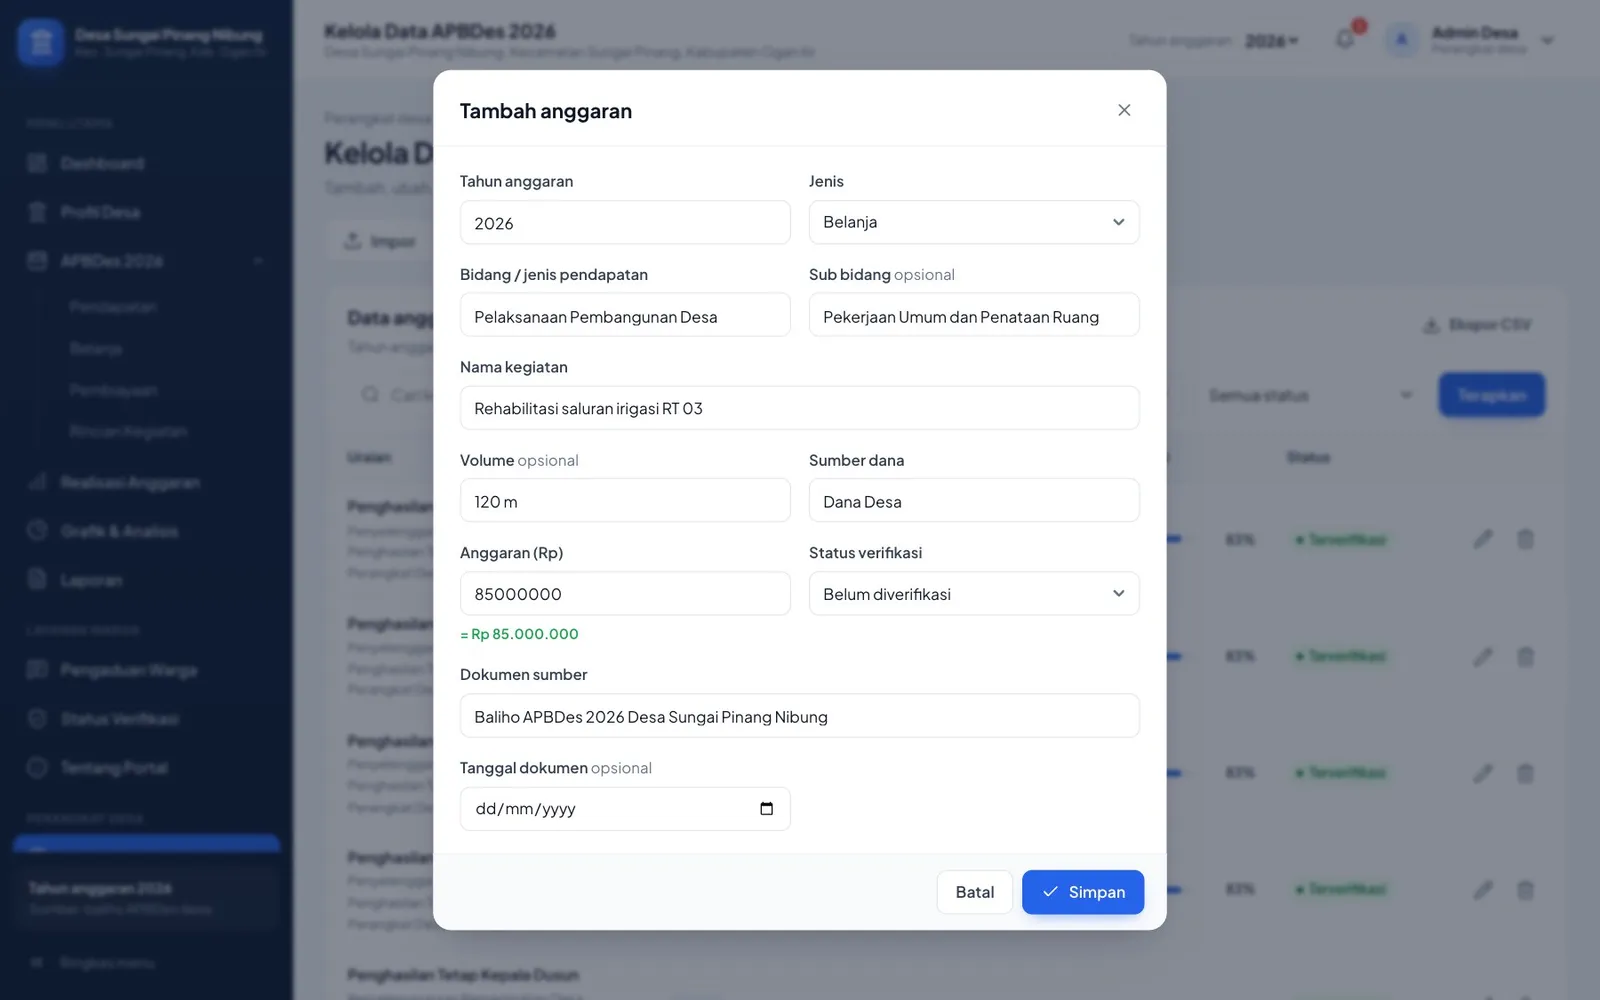
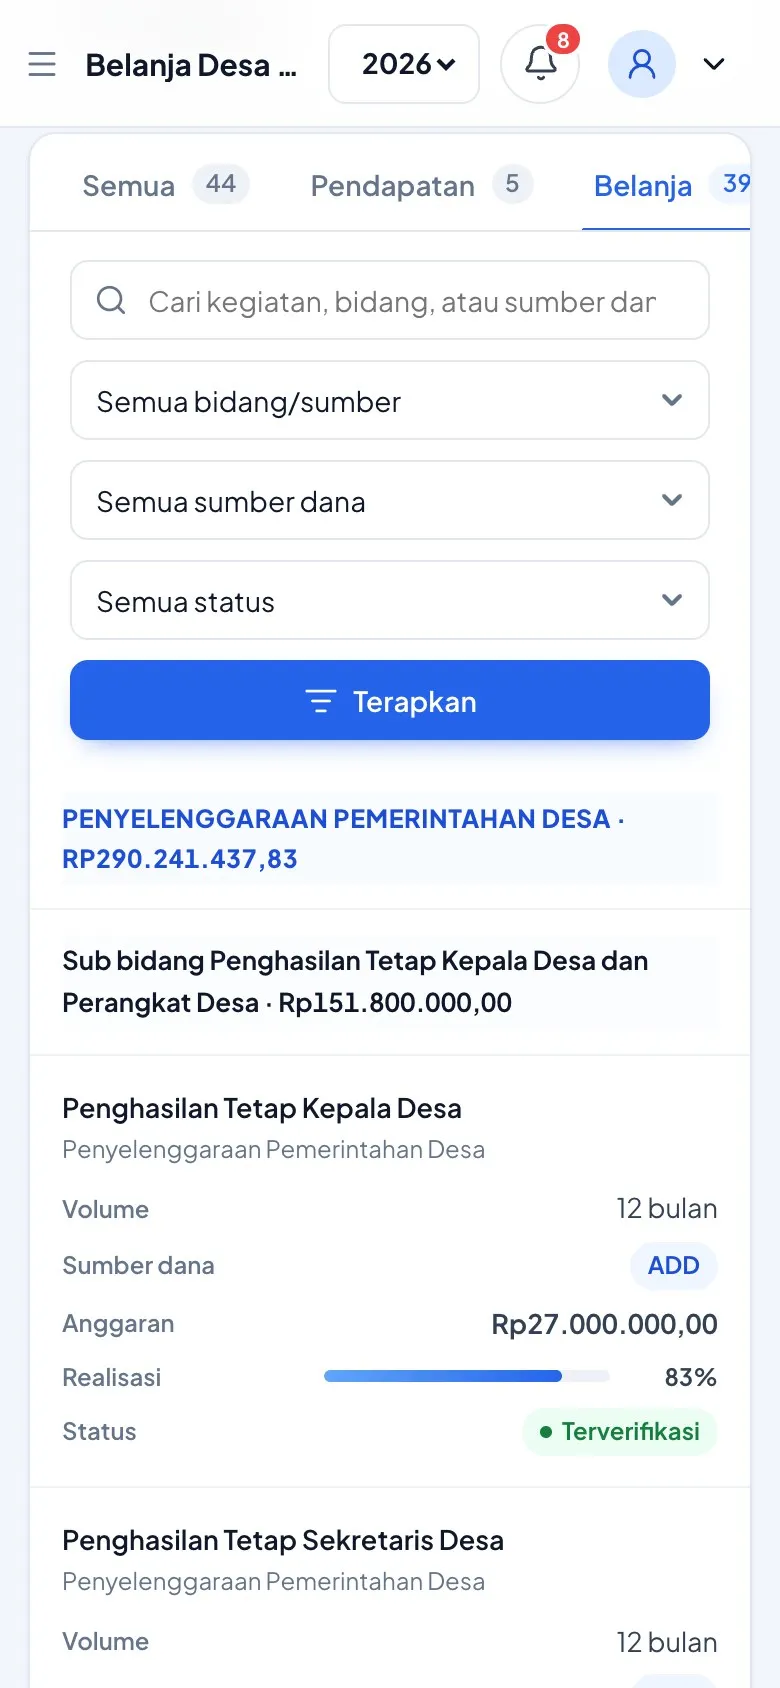
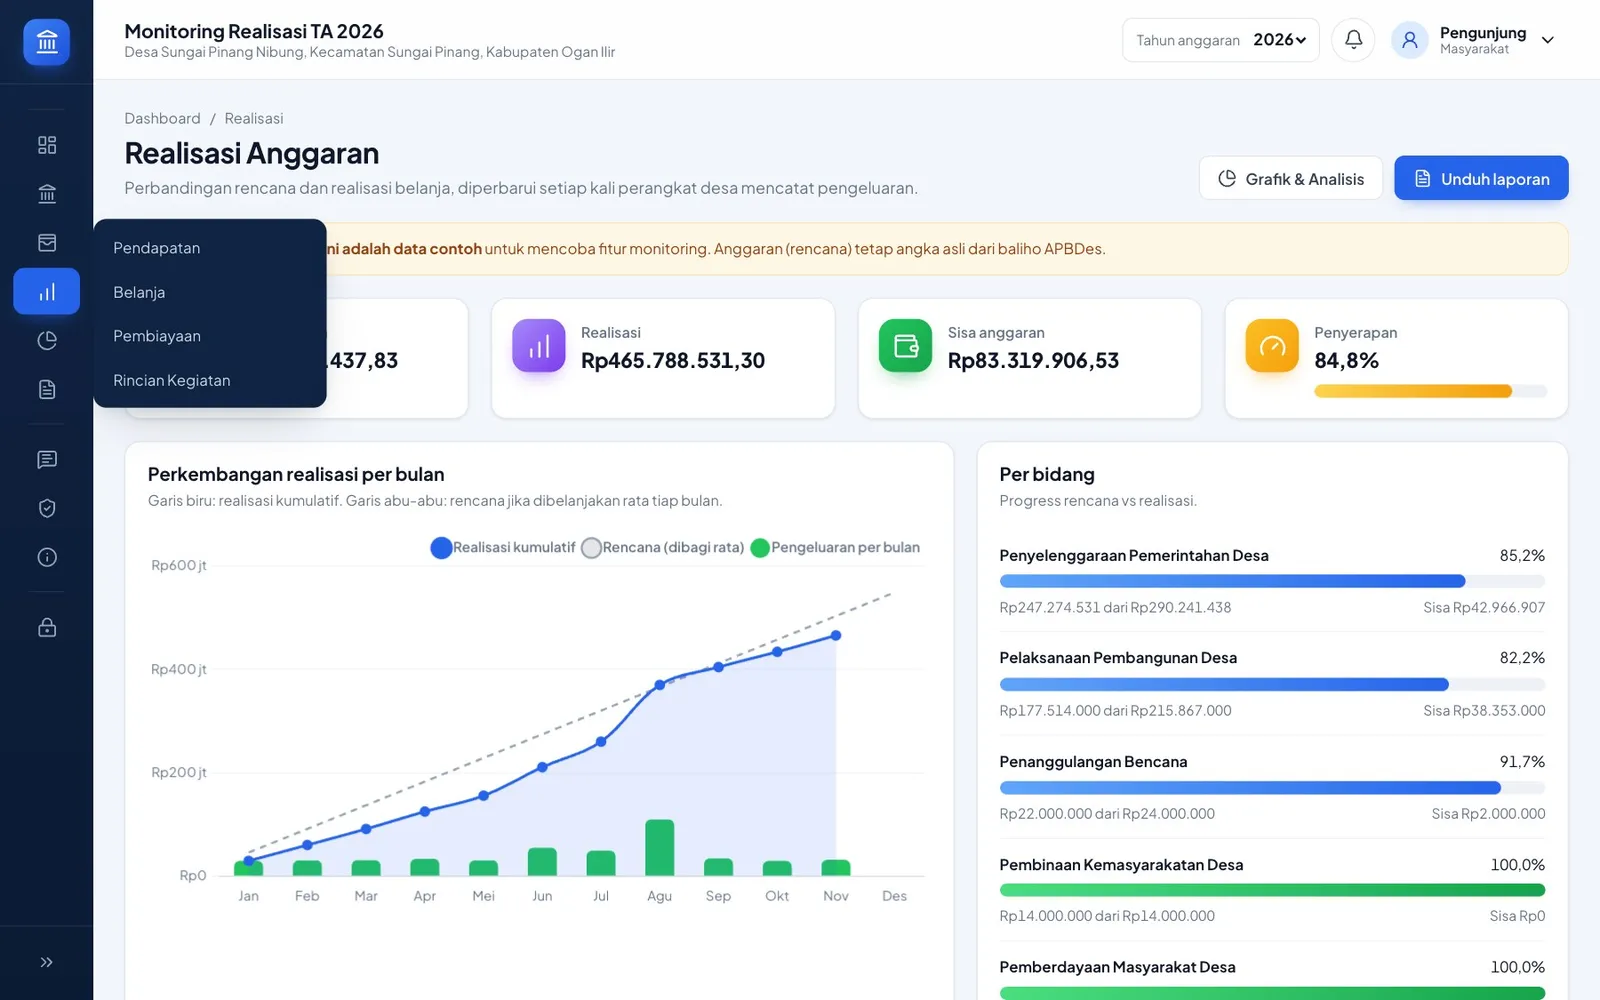
The Laravel application provides a dashboard with income composition, spending per field, plan versus realization progress and recent expenses, plus dedicated pages for income, spending, financing, activity details and charts. Reports are generated automatically per month or semester as a PDF with the village letterhead and signature block, or as an Excel workbook with recap, activity and transaction sheets. Officials can add, edit, delete and import budget lines from a CSV or Excel template, record spending with a warning when it exceeds the budget, and handle complaints through Baru, Diproses and Selesai statuses. A notification bell, keyboard search across activities and an automatic check that spending per funding source matches its income round out the system.

Outcome

Impact and proof points

The system lets anyone in the village see the APBDes and its realization without an account, and download the same reports officials use. Residents can submit complaints, questions or suggestions anonymously and follow the response using a ticket number. The automatic funding source check already flagged a mismatch between Dana Desa and ADD spending in the billboard data, so that line is marked unverified until it is checked against the official APBDes document.

Reflection

What this case says about how I work.

Start from the real workflow before deciding the interface structure.

Make system states visible so users know what happened and what to do next.

Write interface copy that reduces follow-up questions, not just fills empty space.