Maritime weather monitoring dashboard 2026

AtmosWatch

A maritime weather monitoring dashboard for East Java waters that turns BMKG Himawari satellite imagery into an animated map, cold-cloud indicators and a sea-area log.

Python Pillow imageio-ffmpeg JavaScript Leaflet HTML5 Canvas CSS BMKG Himawari imagery
Peran Full-stack Developer
Tahun 2026
Stack Python, Pillow, imageio-ffmpeg, JavaScript
Tim Solo build
Ringkasan

Masalah yang perlu diselesaikan project ini

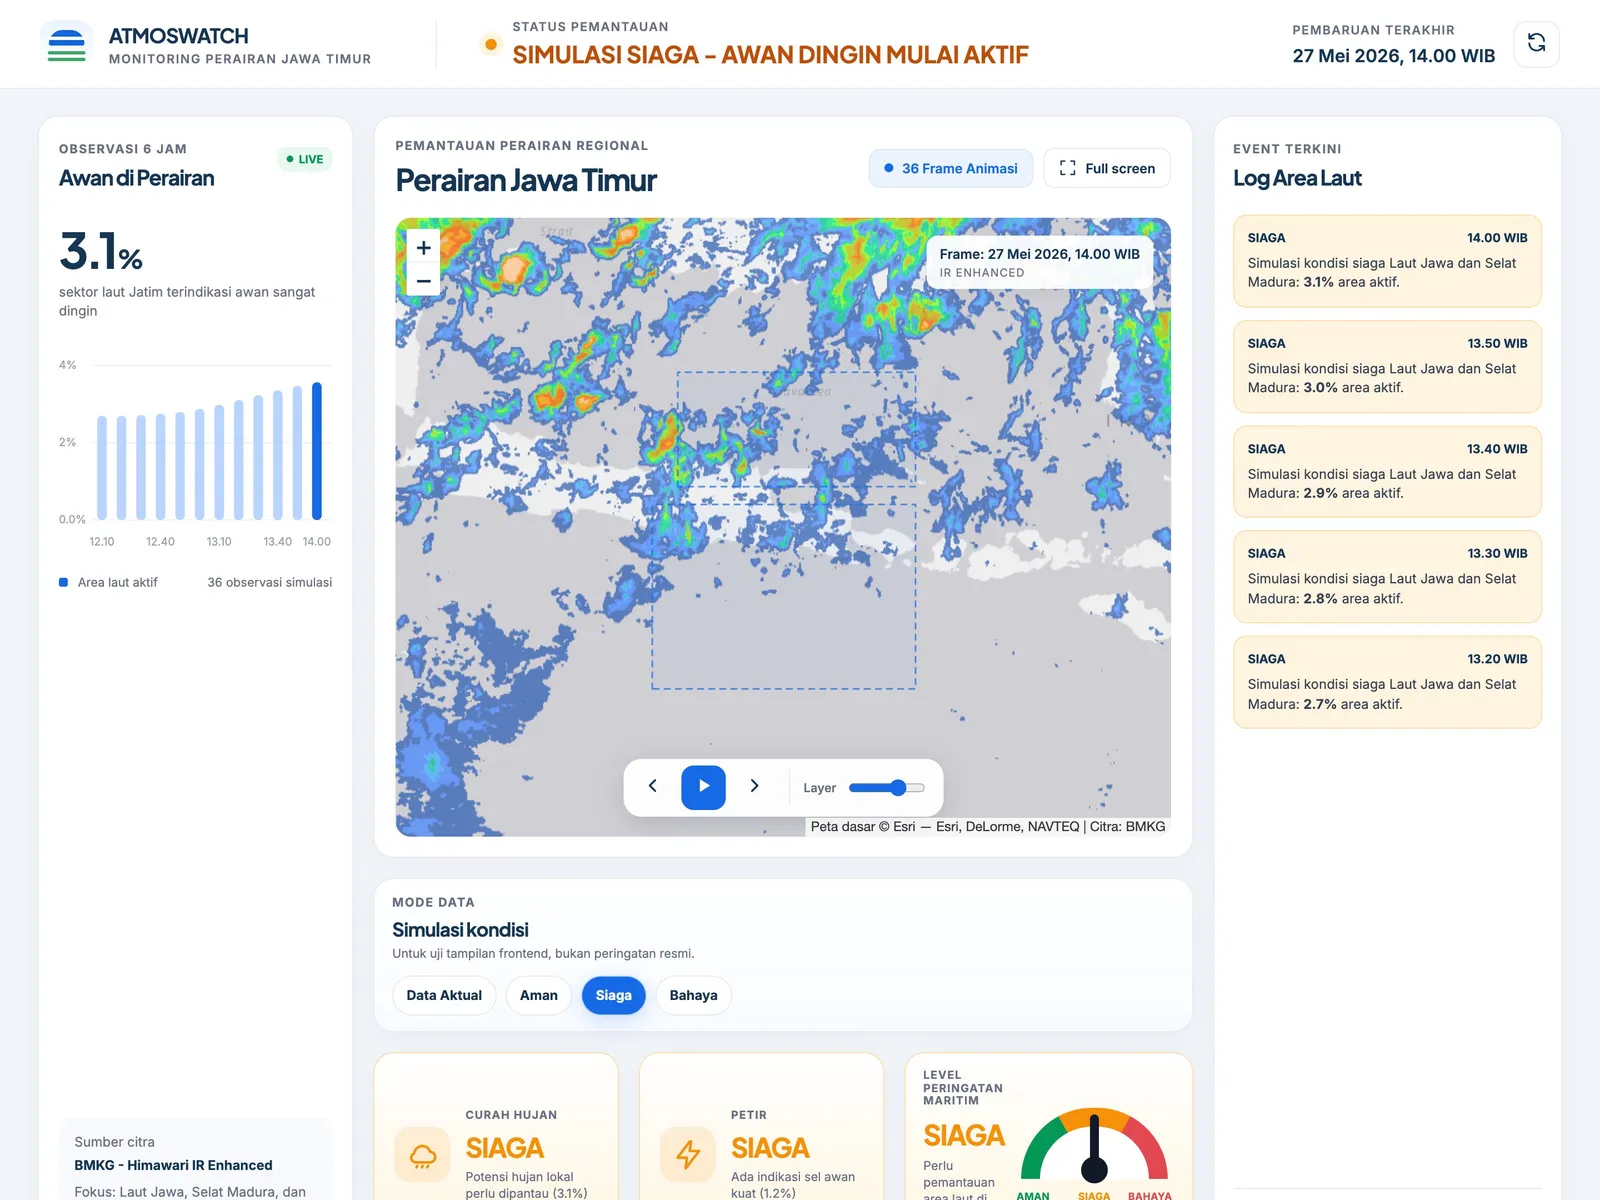
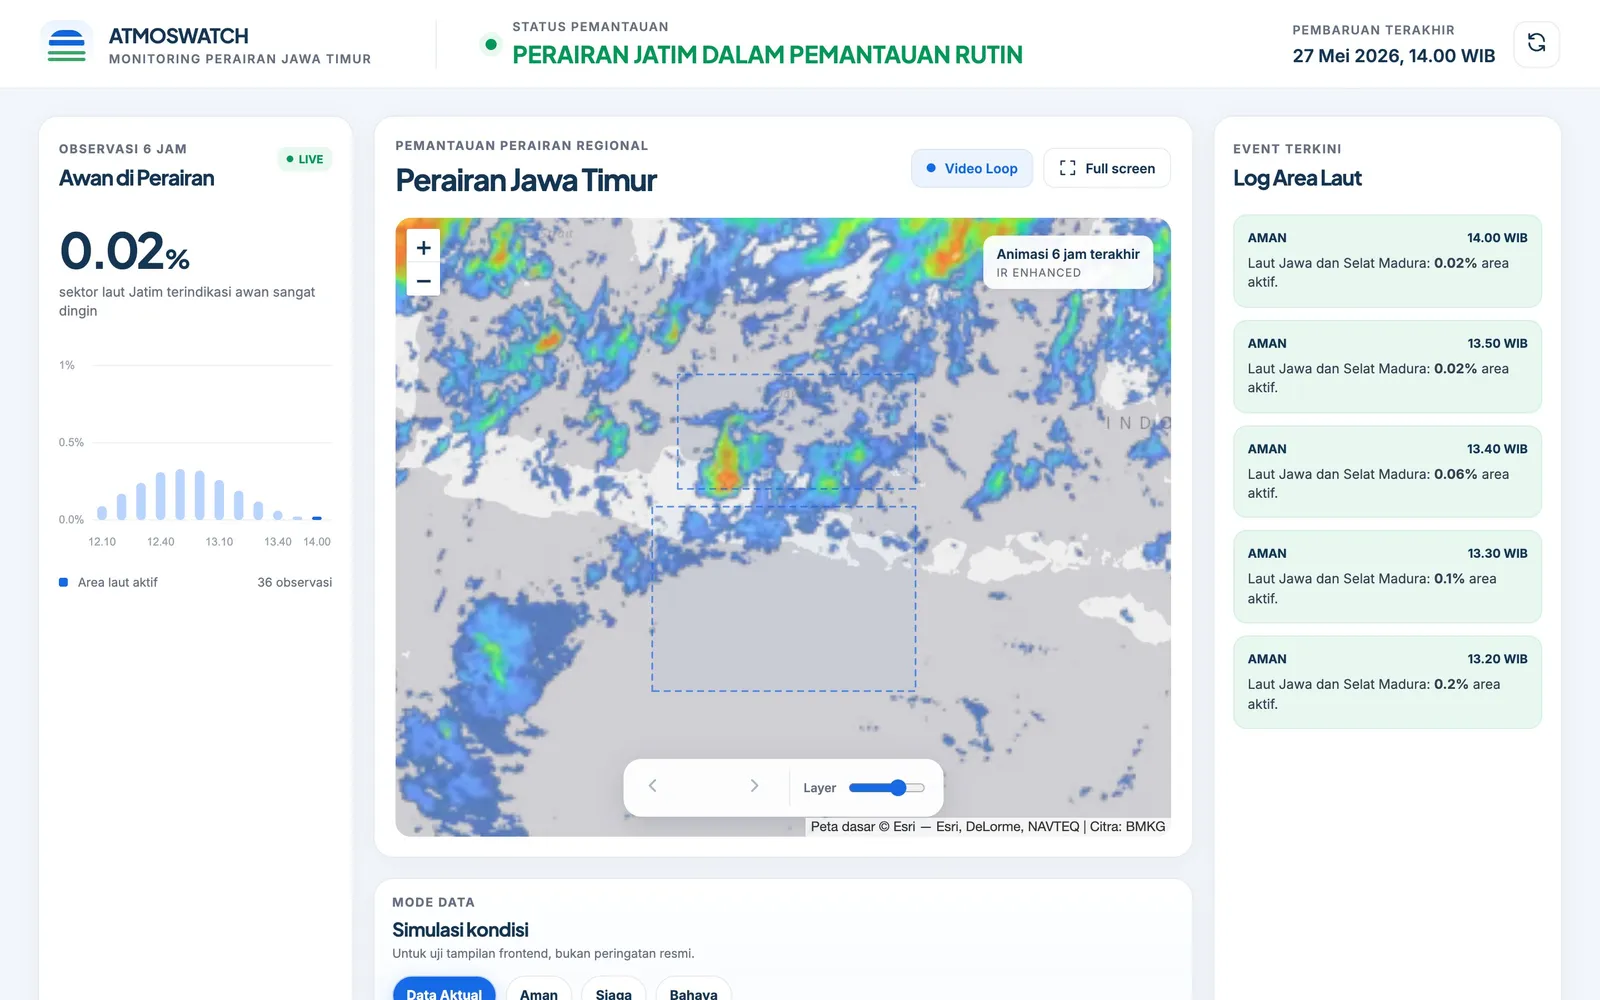
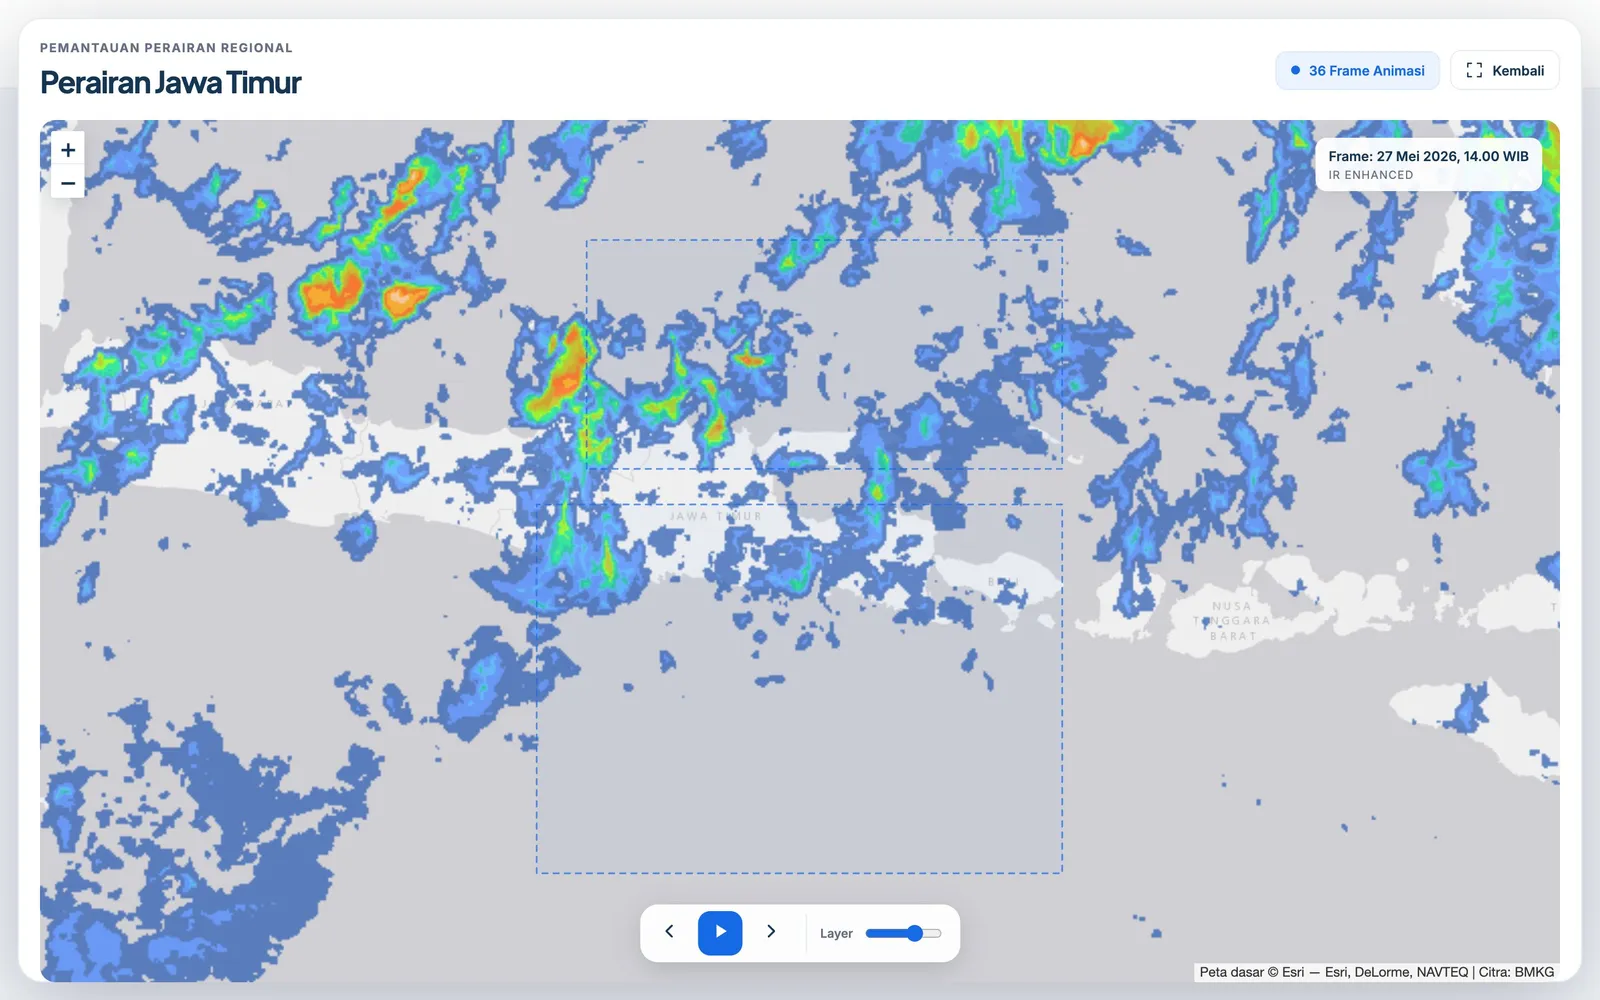
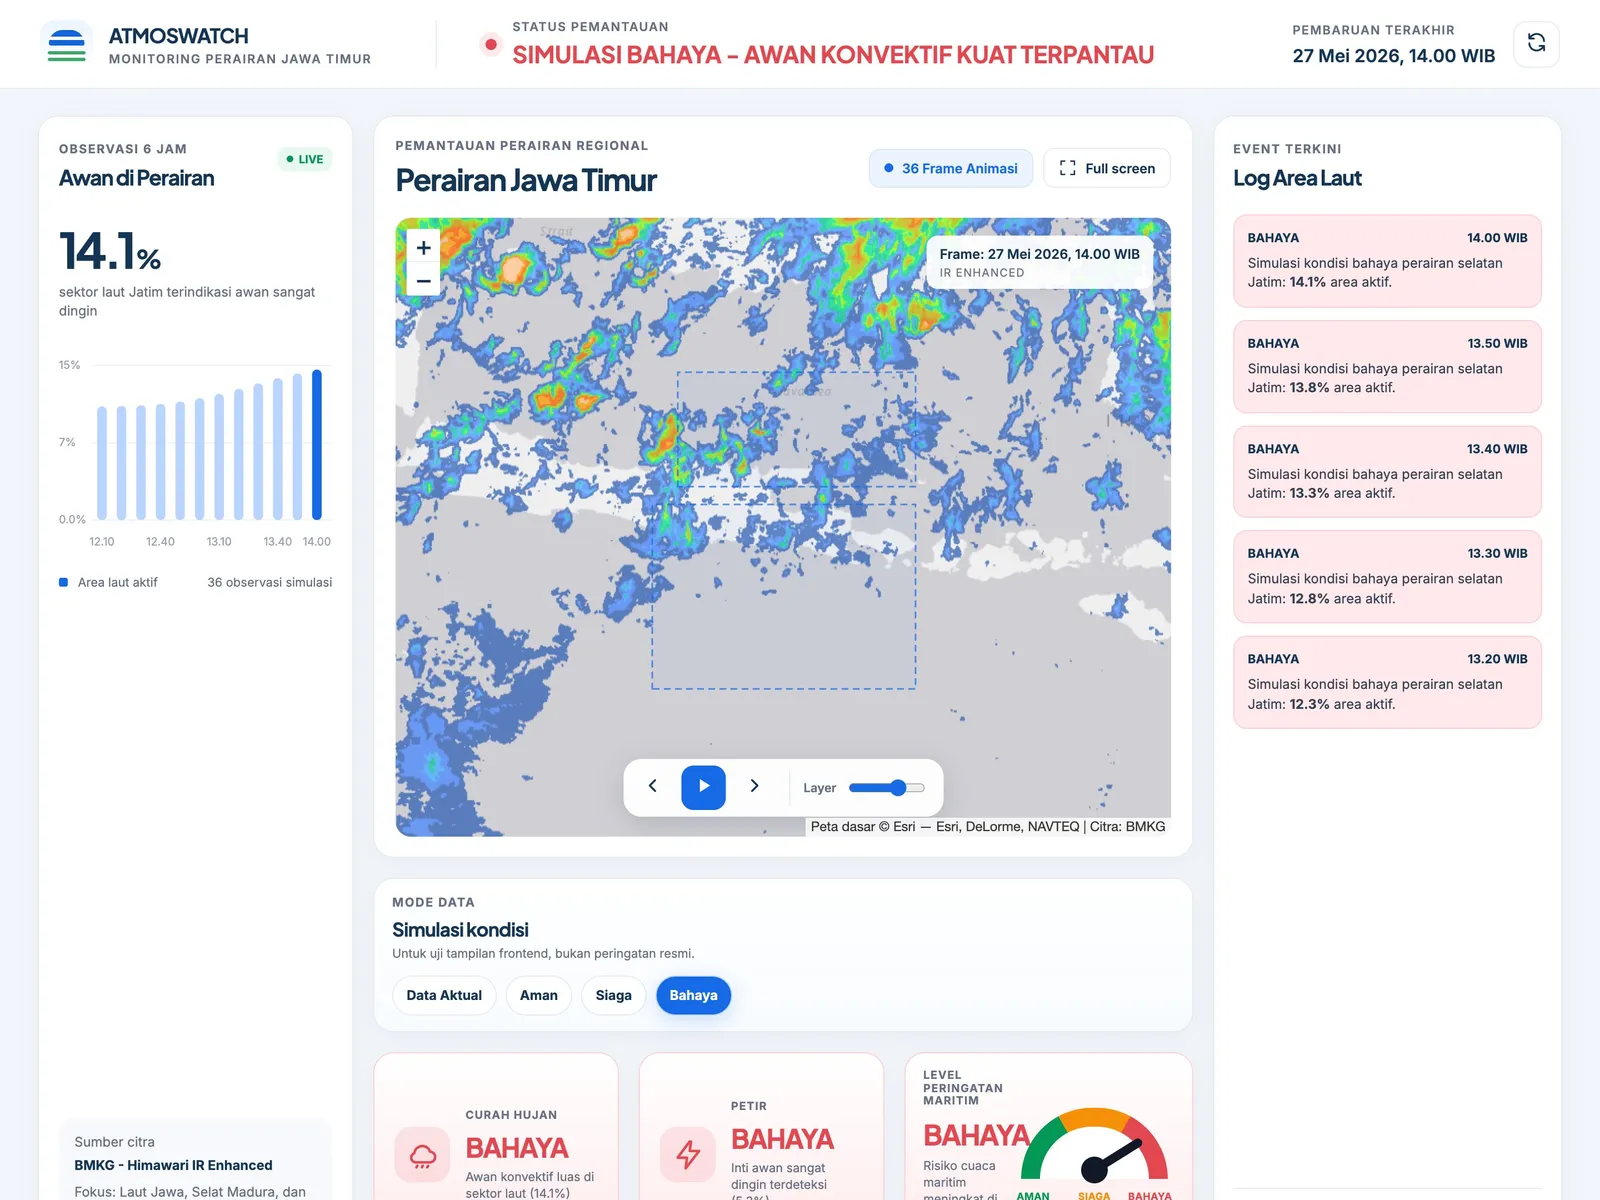
AtmosWatch is a regional monitoring dashboard for the waters around East Java built on BMKG Himawari IR Enhanced satellite imagery. It overlays the latest frames on an interactive Leaflet map with 10-minute frame animation or a six-hour video loop, and calculates cold-cloud indicators for two sea sectors: the Java Sea and Madura Strait, and the southern waters of East Java. A Python downloader fetches new frames, analyzes them and publishes the metadata that drives the status cards, chart and sea-area log. The indicators are a visual interpretation of satellite imagery and are not an official BMKG warning product.
Pembingkaian masalah

Dari workflow yang berantakan menjadi requirement produk yang lebih jelas.

Pekerjaan dimulai dengan memisahkan kebutuhan operasional staf dan kebutuhan customer, lalu mengubahnya menjadi requirement produk yang lebih jelas.

Tantangan

Apa yang membuat pekerjaan ini menantang?

BMKG publishes Himawari IR Enhanced imagery as a single image of all of Indonesia, which is hard to read quickly for one region's waters. Seeing how cloud cover develops over several hours means collecting and lining up many 10-minute frames by hand. The dashboard also had to communicate weather conditions clearly without presenting an image-based estimate as an official warning.

Kebutuhan user dan bisnis

Apa yang perlu dibuat lebih jelas?

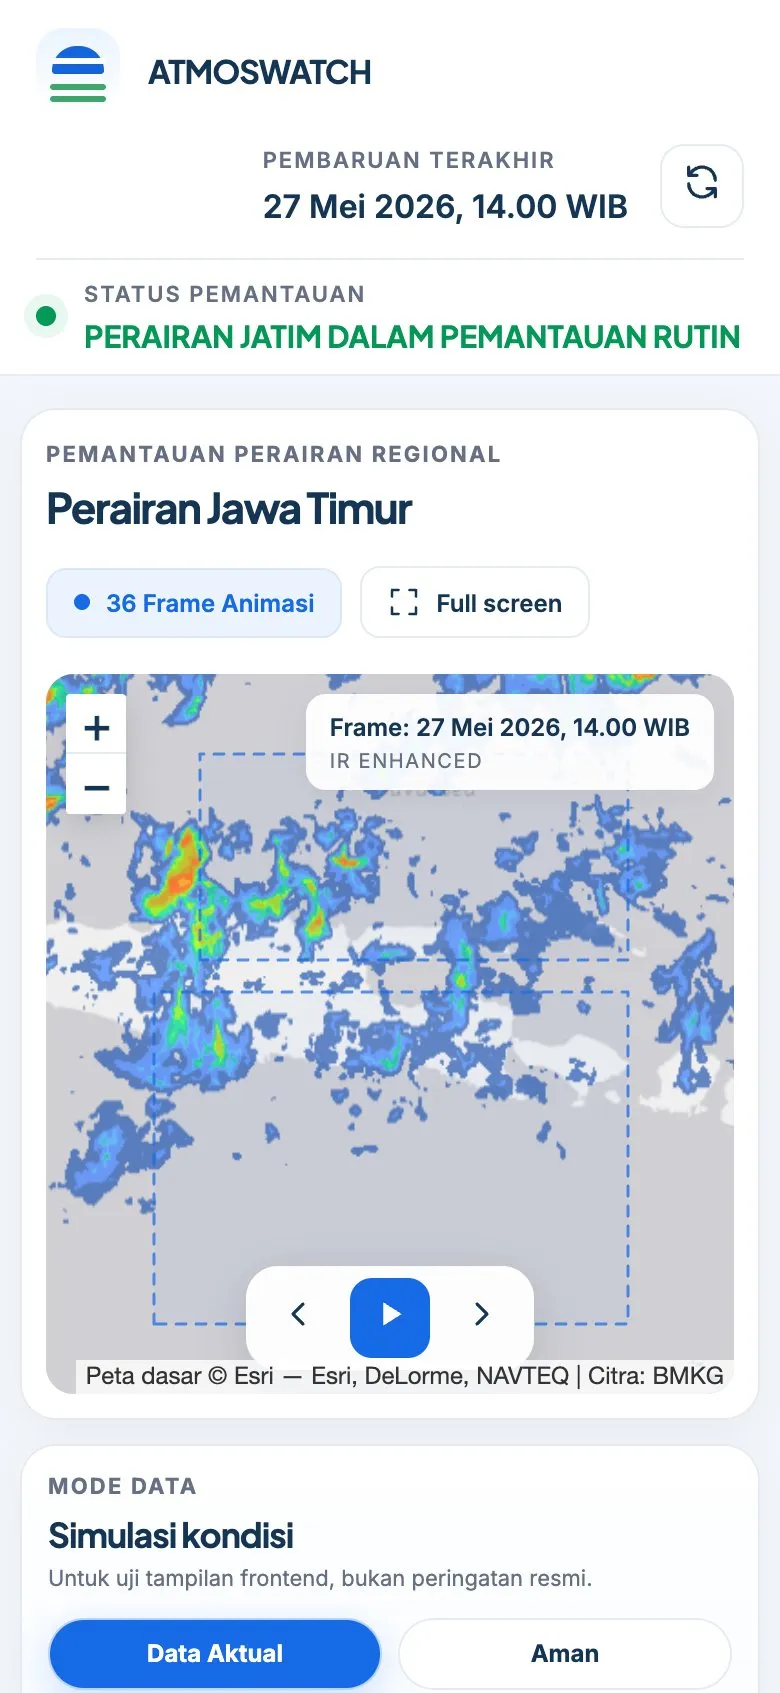
Anyone watching sea conditions around East Java needs a single view that shows recent satellite imagery over a usable map, how cold-cloud activity is changing in the relevant sea sectors, and a clear status level. That view has to update on the same 10-minute rhythm as the source imagery and stay readable on both desktop and phone.

Process

Bagaimana project bergerak dari requirement ke flow yang usable.

01

The data side was designed first: a downloader that fetches the latest and archived frames, georeferences them to the image bounds, and counts orange and red IR Enhanced pixels inside two...

Solusi

Apa yang saya bangun dan kenapa itu penting

The solution pairs a Python script (download_data.py) with a static HTML, CSS and JavaScript dashboard. The script updates the latest image, keeps the last six hours of frames, writes metadata_sat.json and can render a WebM video loop, and it is meant to run from a scheduler every 10 minutes. The dashboard shows the frames on a Leaflet map with an Esri basemap that needs no API key, draws the sector boxes, animates frames or plays the video, and renders rain and lightning indicator cards, a maritime warning gauge, a canvas bar chart and a sea-area log. A full-screen map mode and a clear notice that field validation is needed before issuing warnings complete the interface.

Hasil

Dampak dan bukti pendukung

The dashboard brings the latest six hours of satellite observation for East Java waters into one screen, so cloud development over the Java Sea, Madura Strait and southern waters can be followed at a glance. Because the downloader is designed for scheduled runs, the view can stay current with the 10-minute imagery cycle without manual work. The simulation modes and data-mode separation also make it ready to switch to forecast or API data when a primary data source becomes available.

Refleksi

Apa yang ditunjukkan case ini tentang cara saya bekerja.

Start from the real workflow before deciding the interface structure.

Make system states visible so users know what happened and what to do next.

Write interface copy that reduces follow-up questions, not just fills empty space.