Factory operations dashboard 2026

Dashboard Textile

An operations dashboard for textile printing factories that brings production, shipments, reject (BS) quality and daily reports into one view for directors and supervisors.

Laravel PHP PostgreSQL React Inertia.js Tailwind CSS Apache ECharts Telegram and WhatsApp (Fonnte) API
Role Full-stack Developer
Year 2026
Stack Laravel, PHP, PostgreSQL, React
Team Solo build
Overview

What this project needed to solve

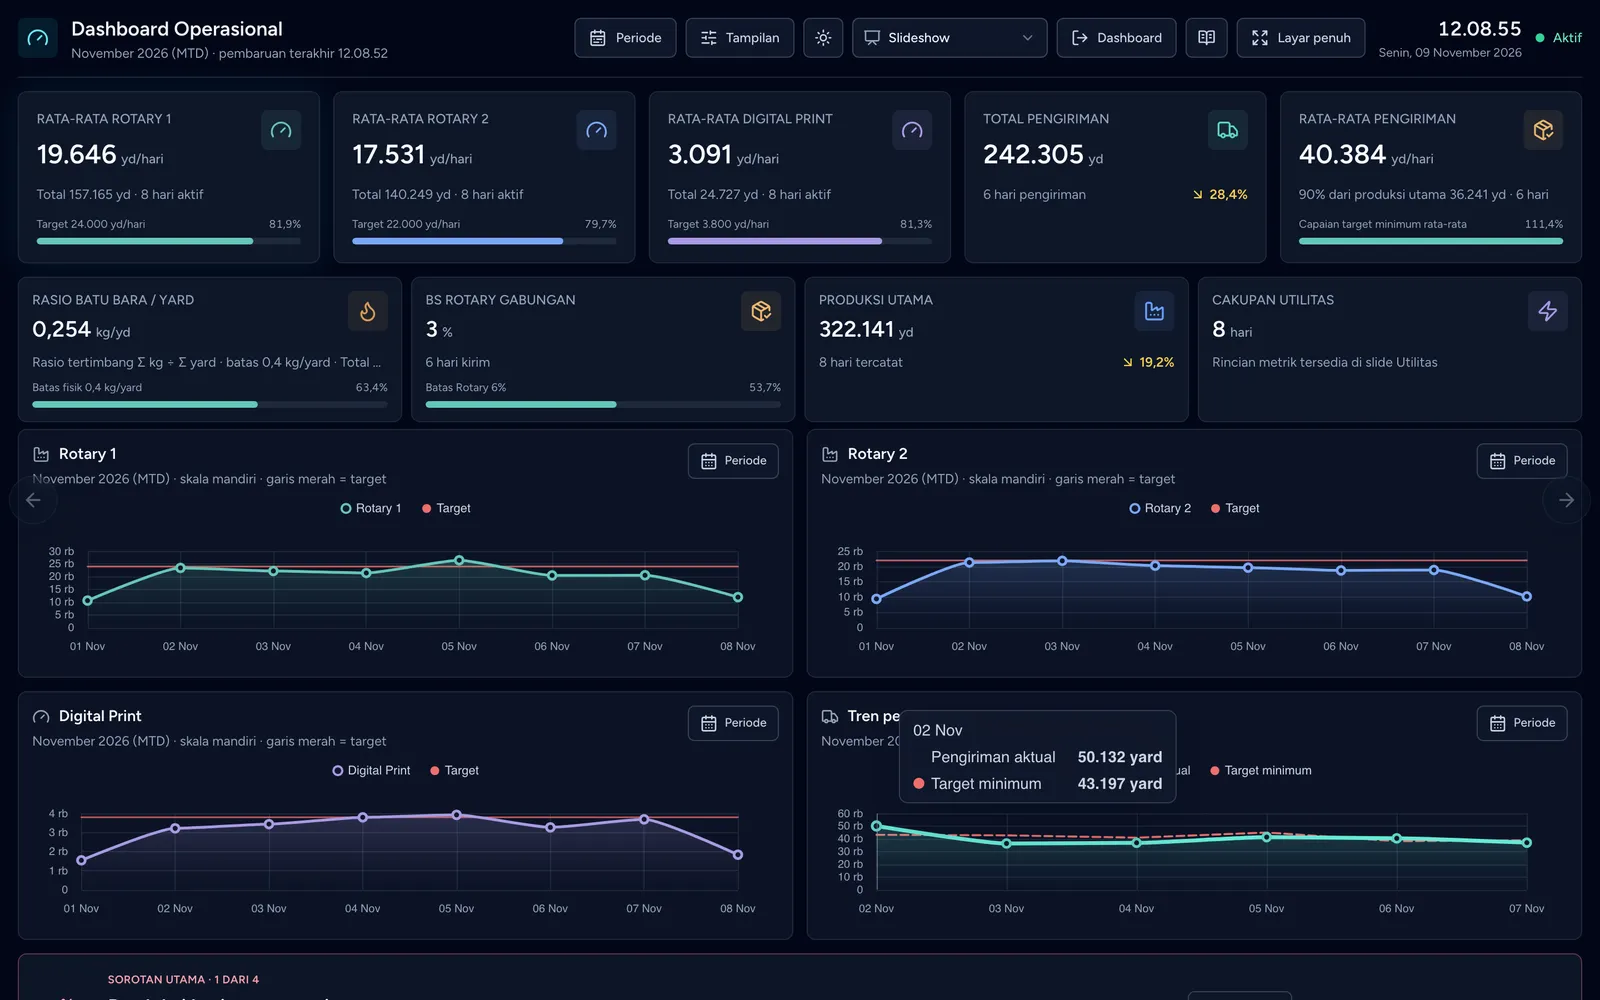
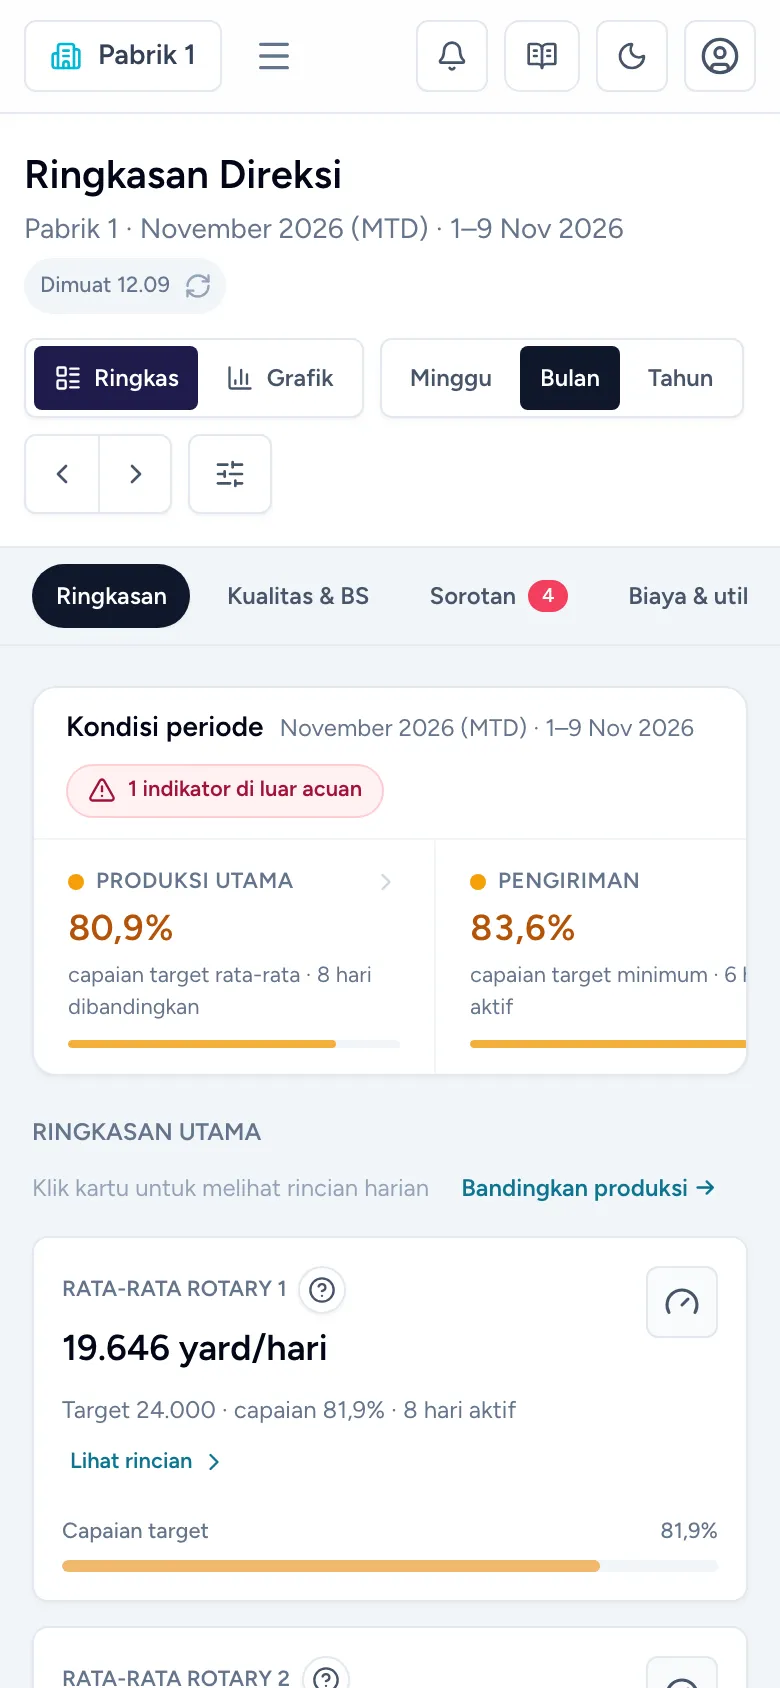
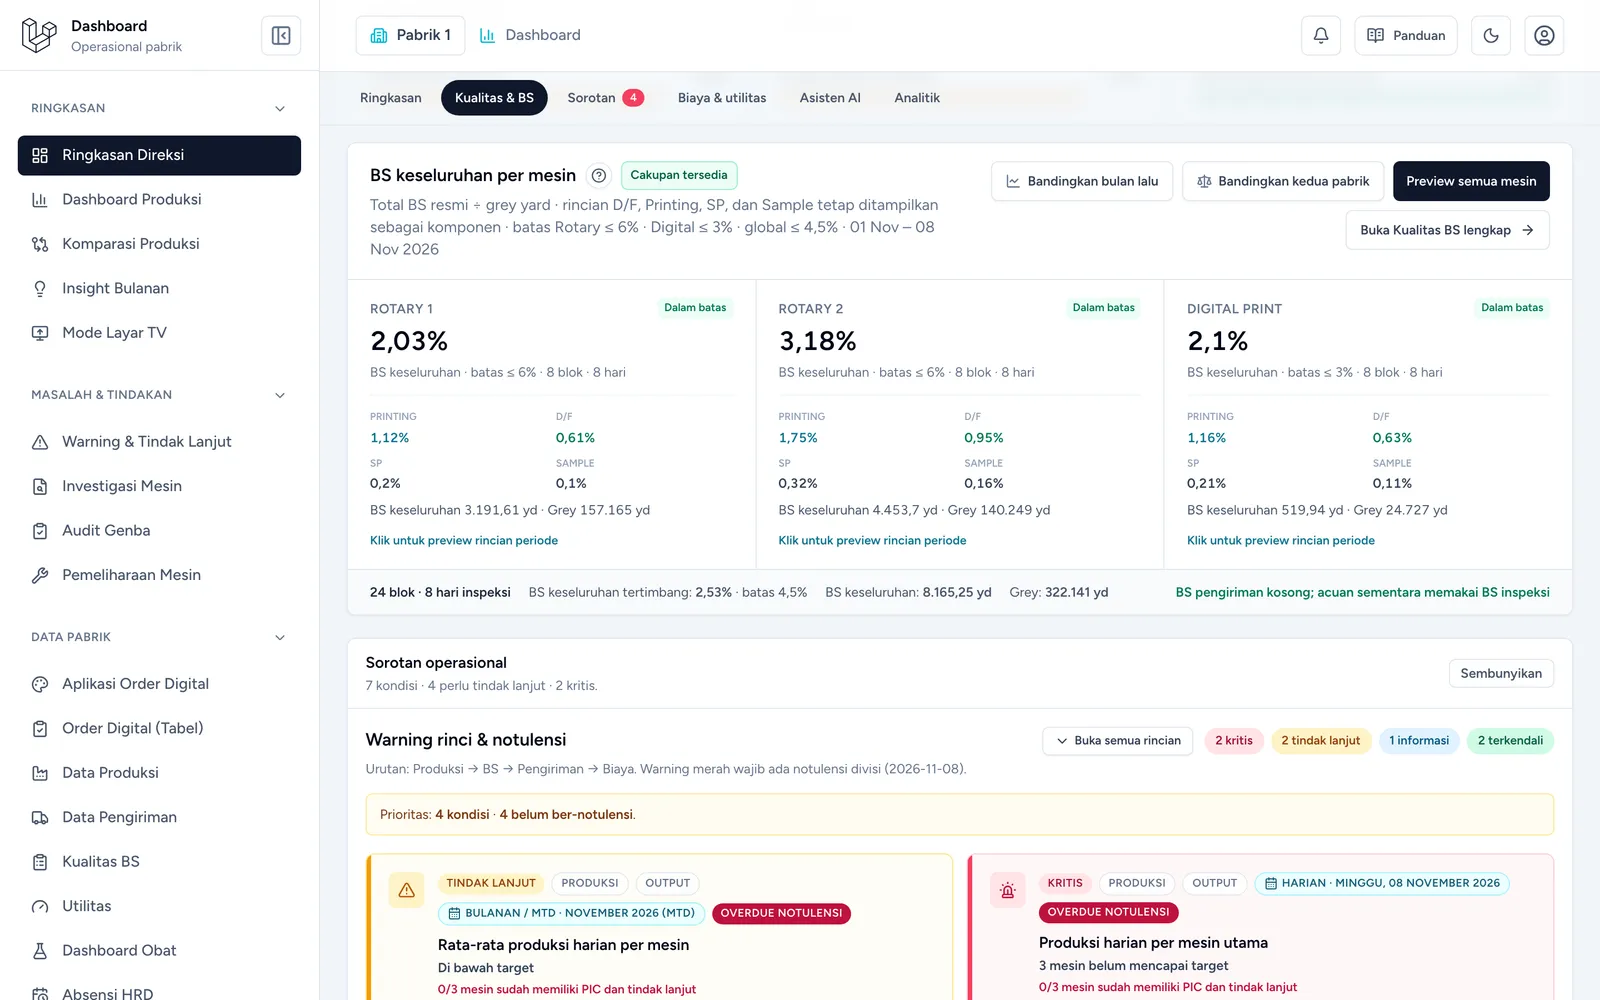
Dashboard Textile is an internal web system built for, and used daily at, the textile printing factories of the group where Yahya works. It turns production, shipment, BS (reject) inspection and utility data into a director summary, trend analysis, machine-level quality views and a wall-mounted TV mode. Data is separated per company, access is controlled by roles and permissions, and daily reports are delivered through Telegram and WhatsApp.
Problem framing

From messy workflow to clearer product requirements.

The work started by separating staff operations from customer booking needs, then turning both into clearer product requirements.

Challenge

What made the work difficult?

Factory data lived in separate Excel workbooks for production, shipments and BS inspection, kept per factory and per shift. Each factory defines its main production differently, so numbers cannot simply be added together, and quality has to be weighted by grey yard rather than averaged.

User and business need

What had to become clearer?

Directors and supervisors needed one trustworthy place to see production against target, shipments, BS quality per machine and open issues, without numbers being invented or mixed between companies.

Process

How the project moved from requirements to usable flow.

01

The system was built as a modular monolith with Laravel and React through Inertia, with business formulas, company isolation and the meaning of zero versus empty data written down as rule...

Solution

What I built and why it mattered

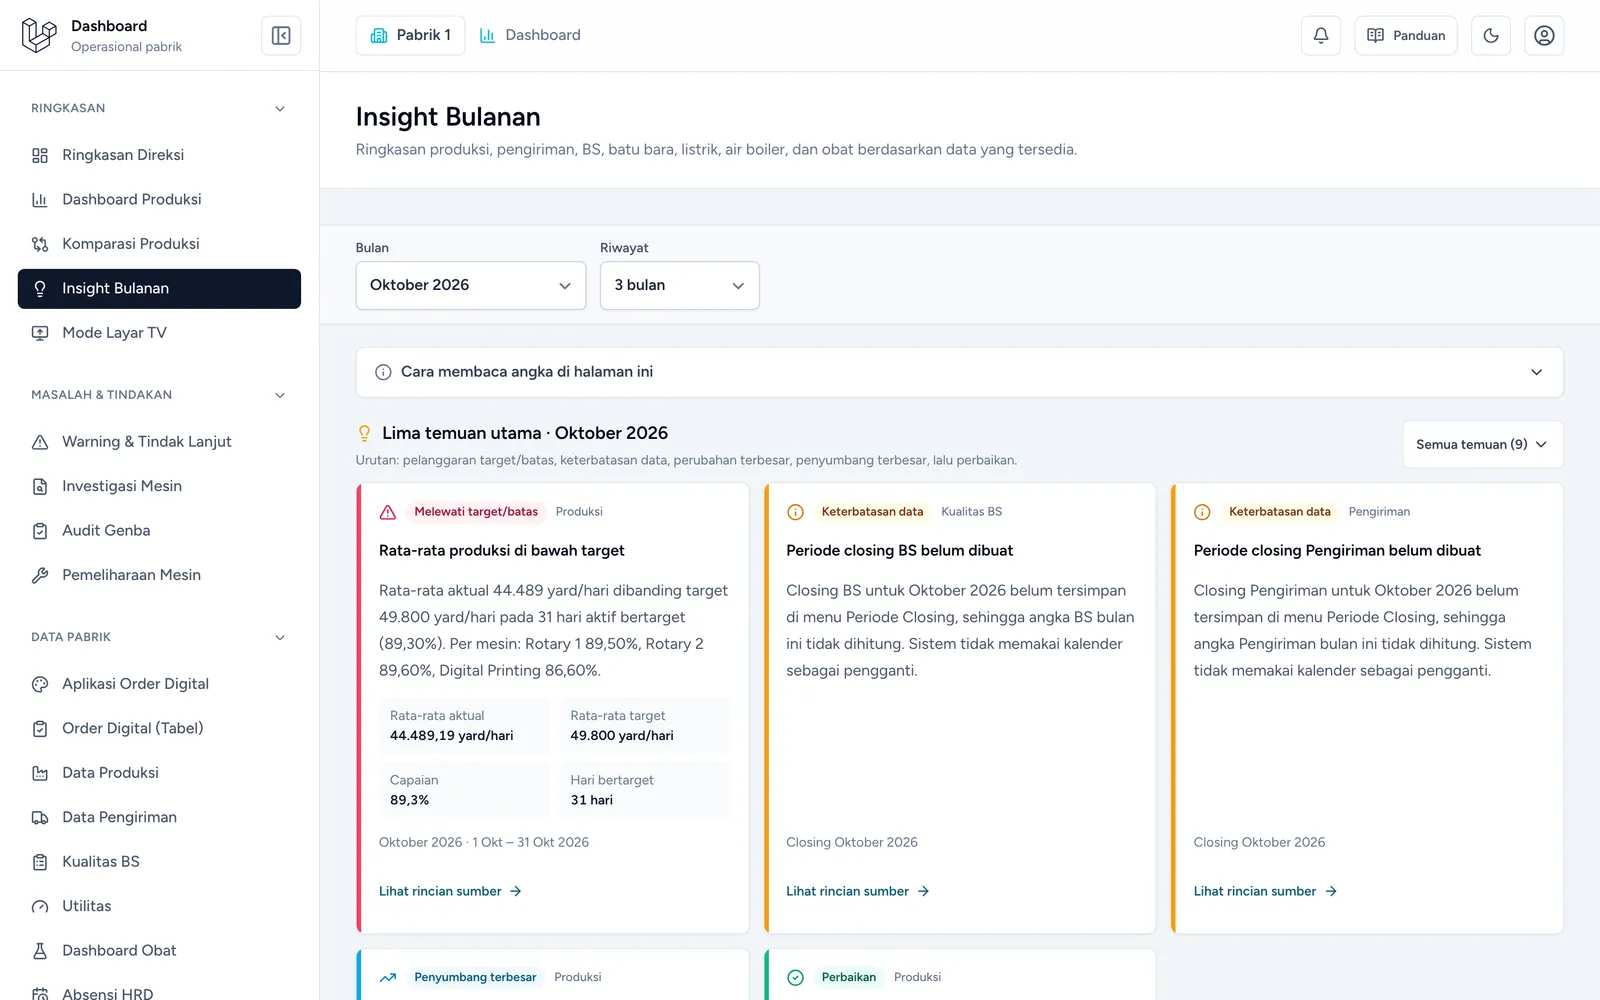
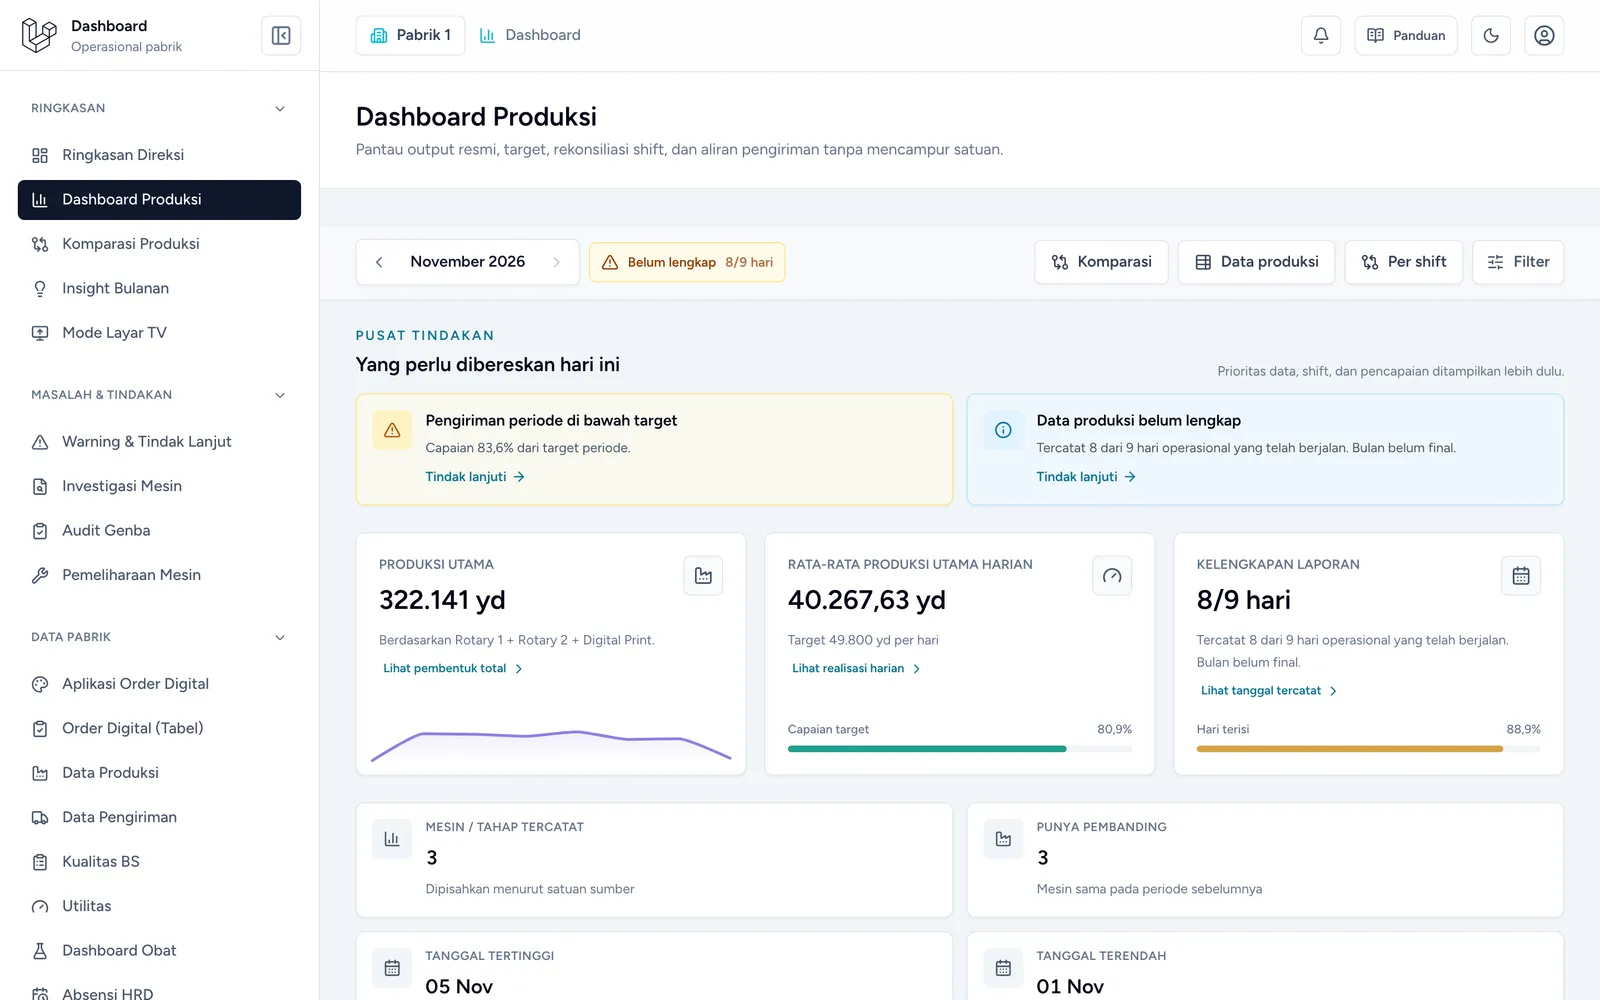
The dashboard offers a director summary with period filters, production and comparison dashboards, monthly insight, BS quality per machine with inspection workbook sync and shipment reconciliation, warnings and follow-up, machine investigation, utilities, and a full-screen TV mode with light and dark themes. Scheduled jobs send the previous day's report, take daily snapshots and run backups, and an AI assistant with usage cost control helps with analysis and reports.

Outcome

Impact and proof points

The dashboard is in daily use at the factory, giving directors and supervisors one shared view of production, shipments and quality instead of collecting separate spreadsheets. The TV mode keeps current figures visible in the production room, and daily reports reach management automatically through Telegram and WhatsApp.

Reflection

What this case says about how I work.

Start from the real workflow before deciding the interface structure.

Make system states visible so users know what happened and what to do next.

Write interface copy that reduces follow-up questions, not just fills empty space.